Food · Puzzle #47 · Sunday, November 15
Food: the board
Eight items, eight categories, one place each. Here is the board with every figure and where it comes from, and the best way to place them. Play today's Food.
The categories
- Watery: 1 pt per 10% water
- Carbs: 1 pt per 6 g of carbs per 100 g
- Calcium: 1 pt per 20 mg of calcium per 100 g
- Sugar rush: 1 pt per 3 g of sugar per 100 g
- Potassium: 1 pt per 60 mg of potassium per 100 g
- Vitamin C: 1 pt per 5 mg of vitamin C per 100 g
- Protein: 1 pt per 2.5 g of protein per 100 g
- Iron: 1 pt per 0.5 mg of iron per 100 g
The best board
- Peanut butter in Potassium: has 558 mg of potassium per 100 g (9.3)
- Beef liver in Protein: has 27 g of protein per 100 g (10.0)
- Brussels sprouts in Vitamin C: has 62 mg of vitamin C per 100 g (10.0)
- Pretzels in Carbs: has 80 g of carbohydrate per 100 g (10.0)
- Radish in Watery: is 95% water (9.5)
- Anchovies in Calcium: has 232 mg of calcium per 100 g (10.0)
- Chocolate cake in Sugar rush: has 40 g of sugar per 100 g (10.0)
- Beef jerky in Iron: has 5.4 mg of iron per 100 g (10.0)
The most this board could score: 78.8 of 80.
The lineup, figure by figure
Peanut butter
Ground peanuts for PB&J
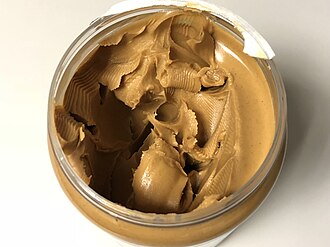
Photo: Famartin, CC BY-SA 4.0 On this board Peanut butter scored best in Potassium (9.3): it has 558 mg of potassium per 100 g. Vitamin C was its weakest fit (0.0): it has 0 mg of vitamin C per 100 g. The best board puts it there too.
- Watery
- is 1.2% water (0.1) Source: USDA FoodData Central
- Carbs
- has 22 g of carbohydrate per 100 g (3.7) Source: USDA FoodData Central
- Calcium
- has 49 mg of calcium per 100 g (2.5) Source: USDA FoodData Central
- Sugar rush
- has 10 g of sugar per 100 g (3.5) Source: USDA FoodData Central
- Potassium
- has 558 mg of potassium per 100 g (9.3) Source: USDA FoodData Central
- Vitamin C
- has 0 mg of vitamin C per 100 g (0.0) Source: USDA FoodData Central
- Protein
- has 22 g of protein per 100 g (8.9) Source: USDA FoodData Central
- Iron
- has 1.7 mg of iron per 100 g (3.5) Source: USDA FoodData Central
Beef liver
Organ meat, often served with onions
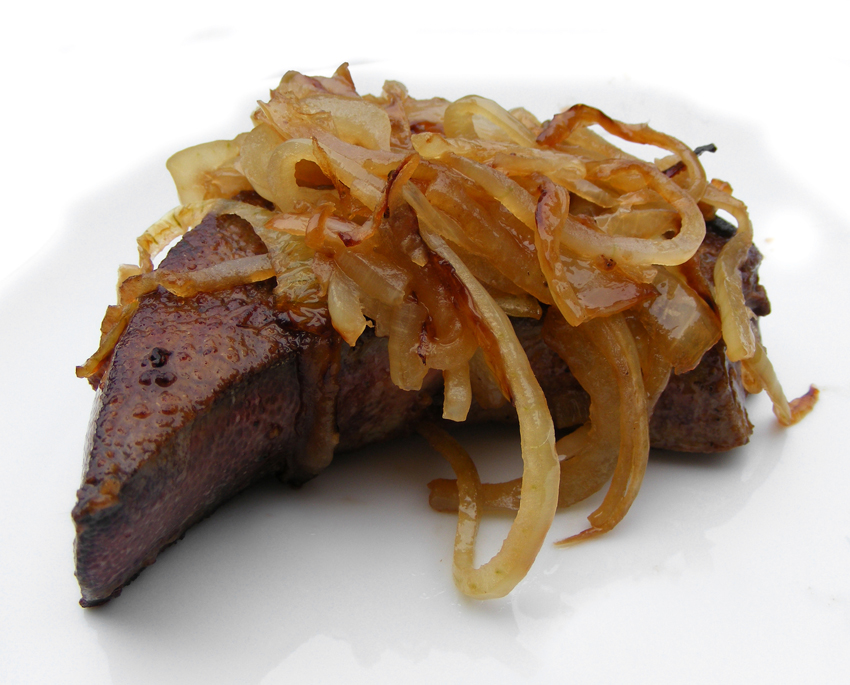
Photo: FotoosVanRobin from Netherlands, CC BY-SA 2.0 Beef liver has 27 g of protein per 100 g, so its best fit on this board was Protein, worth 10.0. Its weakest was Sugar rush, worth 0.0, since it has 0 g of sugar per 100 g. That is where the best board puts it as well.
- Watery
- is 62% water (6.2) Source: USDA FoodData Central
- Carbs
- has 5.2 g of carbohydrate per 100 g (0.9) Source: USDA FoodData Central
- Calcium
- has 6 mg of calcium per 100 g (0.3) Source: USDA FoodData Central
- Sugar rush
- has 0 g of sugar per 100 g (0.0) Source: USDA FoodData Central
- Potassium
- has 351 mg of potassium per 100 g (5.9) Source: USDA FoodData Central
- Vitamin C
- has 0.7 mg of vitamin C per 100 g (0.1) Source: USDA FoodData Central
- Protein
- has 27 g of protein per 100 g (10.0) Source: USDA FoodData Central
- Iron
- has 6.2 mg of iron per 100 g (10.0) Source: USDA FoodData Central
Brussels sprouts
Mini cabbages that grow on a stalk
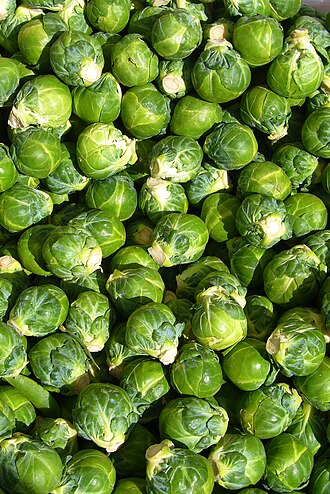
Photo: Eric Hunt, CC BY 2.5 On this board Brussels sprouts scored best in Vitamin C (10.0): they have 62 mg of vitamin C per 100 g. Sugar rush was their weakest fit (0.6): they have 1.7 g of sugar per 100 g. The best board puts them there too.
- Watery
- is 89% water (8.9) Source: USDA FoodData Central
- Carbs
- has 7.1 g of carbohydrate per 100 g (1.2) Source: USDA FoodData Central
- Calcium
- has 36 mg of calcium per 100 g (1.8) Source: USDA FoodData Central
- Sugar rush
- has 1.7 g of sugar per 100 g (0.6) Source: USDA FoodData Central
- Potassium
- has 317 mg of potassium per 100 g (5.3) Source: USDA FoodData Central
- Vitamin C
- has 62 mg of vitamin C per 100 g (10.0) Source: USDA FoodData Central
- Protein
- has 2.5 g of protein per 100 g (1.0) Source: USDA FoodData Central
- Iron
- has 1.2 mg of iron per 100 g (2.4) Source: USDA FoodData Central
Pretzels
Knotted snack of baked dough
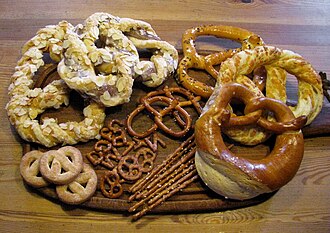
Photo: Sundar1, CC BY-SA 3.0 On this board Pretzels scored best in Carbs (10.0): they have 80 g of carbohydrate per 100 g. Watery was their weakest fit (0.3): they are 3.1% water. The best board puts them there too.
- Watery
- is 3.1% water (0.3) Source: USDA FoodData Central
- Carbs
- has 80 g of carbohydrate per 100 g (10.0) Source: USDA FoodData Central
- Calcium
- has 27 mg of calcium per 100 g (1.4) Source: USDA FoodData Central
- Sugar rush
- has 2.2 g of sugar per 100 g (0.7) Source: USDA FoodData Central
- Potassium
- has 223 mg of potassium per 100 g (3.7) Source: USDA FoodData Central
- Vitamin C
- has 2.1 mg of vitamin C per 100 g (0.4) Source: USDA FoodData Central
- Protein
- has 10 g of protein per 100 g (4.0) Source: USDA FoodData Central
- Iron
- has 4.6 mg of iron per 100 g (9.2) Source: USDA FoodData Central
Radish
Peppery little root, red outside
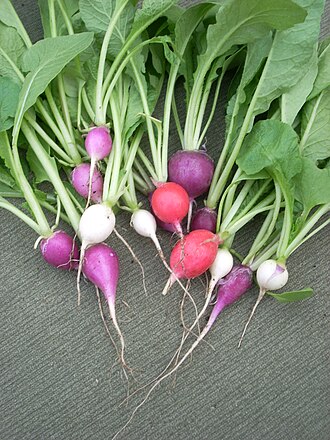
Photo: Self, en:User:Jengod, Public domain On this board Radish scored best in Watery (9.5): it is 95% water. Protein was its weakest fit (0.3): it has 0.68 g of protein per 100 g. The best board puts it there too.
- Watery
- is 95% water (9.5) Source: USDA FoodData Central
- Carbs
- has 3.4 g of carbohydrate per 100 g (0.6) Source: USDA FoodData Central
- Calcium
- has 25 mg of calcium per 100 g (1.3) Source: USDA FoodData Central
- Sugar rush
- has 1.9 g of sugar per 100 g (0.6) Source: USDA FoodData Central
- Potassium
- has 233 mg of potassium per 100 g (3.9) Source: USDA FoodData Central
- Vitamin C
- has 15 mg of vitamin C per 100 g (3.0) Source: USDA FoodData Central
- Protein
- has 0.68 g of protein per 100 g (0.3) Source: USDA FoodData Central
- Iron
- has 0.34 mg of iron per 100 g (0.7) Source: USDA FoodData Central
Anchovies
Tiny cured fish on pizza
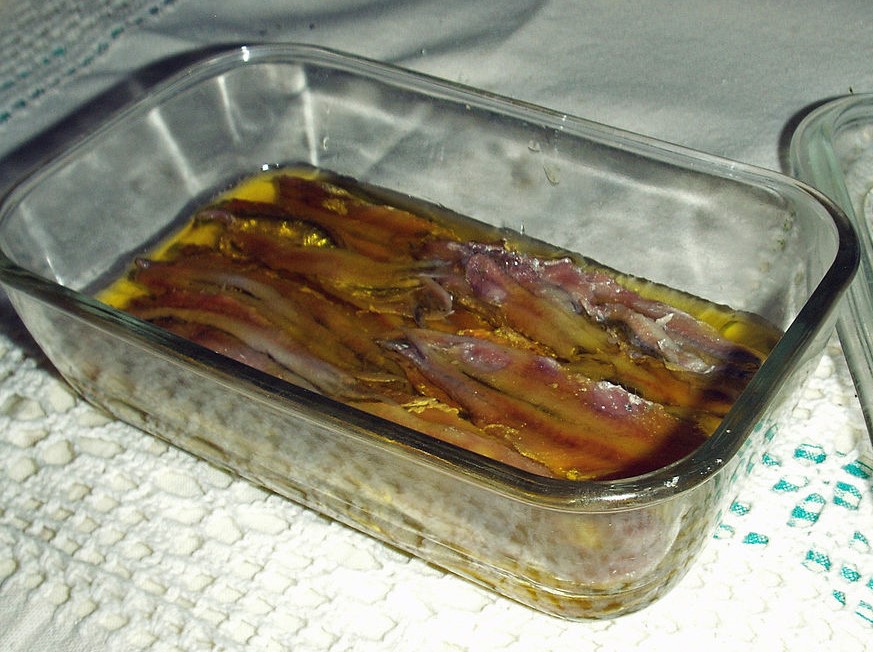
Photo: Roger469, CC BY-SA 3.0 Anchovies have 232 mg of calcium per 100 g, so their best fit on this board was Calcium, worth 10.0. Their weakest was Carbs, worth 0.0, since they have 0 g of carbohydrate per 100 g. That is where the best board puts them as well.
- Watery
- is 50% water (5.0) Source: USDA FoodData Central
- Carbs
- has 0 g of carbohydrate per 100 g (0.0) Source: USDA FoodData Central
- Calcium
- has 232 mg of calcium per 100 g (10.0) Source: USDA FoodData Central
- Sugar rush
- has 0 g of sugar per 100 g (0.0) Source: USDA FoodData Central
- Potassium
- has 544 mg of potassium per 100 g (9.1) Source: USDA FoodData Central
- Vitamin C
- has 0 mg of vitamin C per 100 g (0.0) Source: USDA FoodData Central
- Protein
- has 29 g of protein per 100 g (10.0) Source: USDA FoodData Central
- Iron
- has 4.6 mg of iron per 100 g (9.3) Source: USDA FoodData Central
Chocolate cake
Layer cake with chocolate frosting

Photo: Tracy Hunter from Kabul,, Afghanistan, CC BY 2.0 Chocolate cake has 40 g of sugar per 100 g, so its best fit on this board was Sugar rush, worth 10.0. Its weakest was Vitamin C, worth 0.0, since it has 0.1 mg of vitamin C per 100 g. That is where the best board puts it as well.
- Watery
- is 22% water (2.2) Source: USDA FoodData Central
- Carbs
- has 53 g of carbohydrate per 100 g (8.8) Source: USDA FoodData Central
- Calcium
- has 30 mg of calcium per 100 g (1.5) Source: USDA FoodData Central
- Sugar rush
- has 40 g of sugar per 100 g (10.0) Source: USDA FoodData Central
- Potassium
- has 270 mg of potassium per 100 g (4.5) Source: USDA FoodData Central
- Vitamin C
- has 0.1 mg of vitamin C per 100 g (0.0) Source: USDA FoodData Central
- Protein
- has 3.5 g of protein per 100 g (1.4) Source: USDA FoodData Central
- Iron
- has 3 mg of iron per 100 g (6.1) Source: USDA FoodData Central
Beef jerky
Dried, seasoned strips of beef
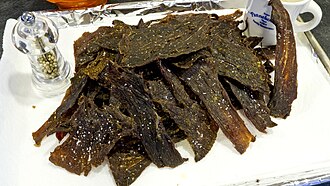
Photo: Larry Jacobsen from Cheyenne Wyoming, CC BY 2.0 On this board Beef jerky scored best in Iron (10.0): it has 5.4 mg of iron per 100 g. Vitamin C was its weakest fit (0.0): it has 0 mg of vitamin C per 100 g. The best board puts it there too.
- Watery
- is 23% water (2.3) Source: USDA FoodData Central
- Carbs
- has 11 g of carbohydrate per 100 g (1.8) Source: USDA FoodData Central
- Calcium
- has 20 mg of calcium per 100 g (1.0) Source: USDA FoodData Central
- Sugar rush
- has 9 g of sugar per 100 g (3.0) Source: USDA FoodData Central
- Potassium
- has 597 mg of potassium per 100 g (10.0) Source: USDA FoodData Central
- Vitamin C
- has 0 mg of vitamin C per 100 g (0.0) Source: USDA FoodData Central
- Protein
- has 33 g of protein per 100 g (10.0) Source: USDA FoodData Central
- Iron
- has 5.4 mg of iron per 100 g (10.0) Source: USDA FoodData Central


